US national debt
U.S. total national debt is reaching dangerous levels, situation is worsening by the payment balance transformations and composition of treasury bonds holders.
It's not a secret that the U.S. debt to GDP ratio is close to the historic high. This ratio was higher only during the Second World War.
The debt expansive growth started during the 2008 crisis, when it involvement was the highest both in absolute terms and relative to GDP.
When we look at the graph, be advised that 18% of USA GDP is composed of statistical additions, which in fact do not contribute to the "taxable GDP", which alone can be a source of state revenues to service the national debt (see insertion 1).
Read more about figures relativity on GDP volume as in the case of Russia; see "What is going on with Russian economy?"
U.S. total public debt, its change and nominal GDP ratio

* with respect to the previous year
Statistical additions
All countries modify periodically the method of GDP calculation and include new components into it. The last major revaluation in USA was in 2013. According to Brent Moulton, National Accounts Manager in the U.S. Bureau of Economic Analysis, this revaluation "actually rewrote the economic history since 1929".
Many of the components, although they look like GDP seamless modification as an indicator of the economic situation, do not provide the government with additional revenue.
One of the most striking examples is the "imputed rent". This is a virtual payment of the residential property owner to himself, while living he lives there. On the one hand, its inclusion into GDP is reasonable, on the other hand, the imputed rent is tax-exempt, and hence, does not contribute to the state income.
Statistical additions to GDP, % of GDP

*including: the rent of non-residents' fixed assets owned by non-profit organizations; payment of insurance premiums on property insurance against accidents; profits derived from the pension funds management; food products consumed by a manufacturer; profit from the construction of own residential property.
Will the U.S. be able to keep the balance?
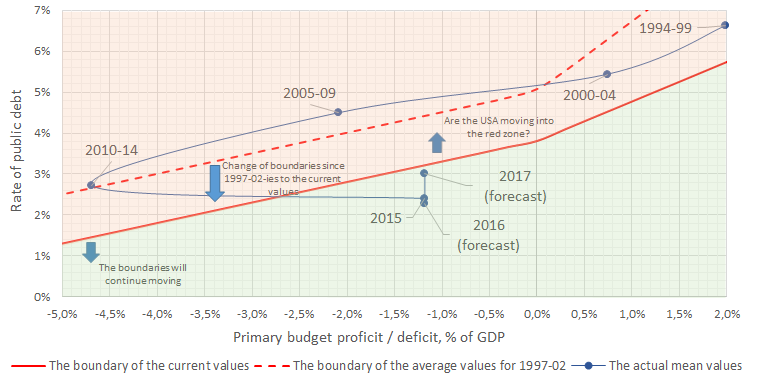
To analyse the U.S. debt market stability we divided conditionally the entire field of the debt cost key parameters opportunities and primary budget deficit (deficit excluding debt service costs) into the red and green zones.
While the U.S. economy is in the red zone the debt to GDP ratio will exceed for sure 200%, and while it is in the green zone, it won't exceed for sure 200%. The figure of 200% was chosen arbitrarily as psychologically significant for the market.
At the end of the 1990ies the budget surplus made up the high debt rate. Then the reduction of budget surplus (which passed later into the deficit) kept the U.S. in the red zone.
The rate slashing allowed the United States moving into the green zone, but along with the debt growth and decrease in the average growth rate, the boundary of the red zone significantly shifted downwards.
Now no one doubts that the rates in the U.S. financial market will grow. In addition, Donald Trump's election as a president is likely to increase the primary budget deficit, because of possible tax cuts. Thus, in 2017 the UnitedU.S. economical situation

States will approach the red zone. Moreover, with the debt growth the boundary of the red zone will continue to slope down.
Did we figure all out well?
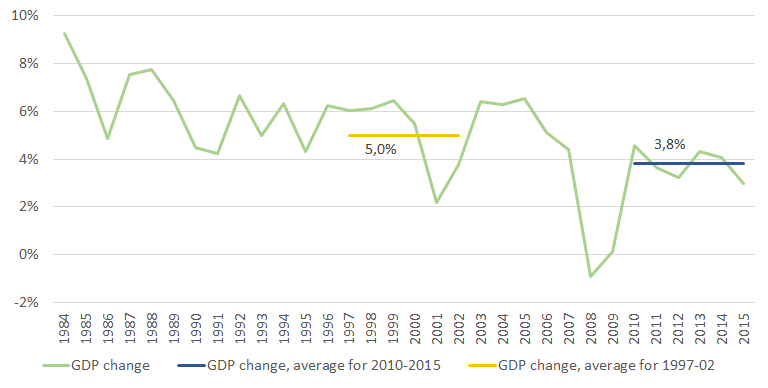
Over the past six years the U.S. nominal GDP grew in an fairly steady pace – about 3.8% per year. This figure is used in the model as a prerequisite for the calculation of the current values limit. The average GDP growth rate for the given period (5.0%) was taken to calculate the average values limit for 1997-02.
The public debt to GDP ratio in 1997-02 was on average at 58% level, this proportion increased to 103.8% by 2015. These values are used to calculate the limits in the graph "The U. S. economical situation".
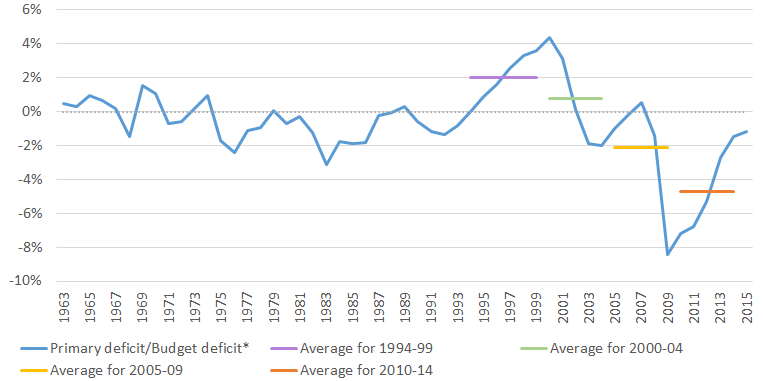
The end of the 90ies, as can be seen from the graph below, was a rare period of strong U. S. budget surplus. The subsequent outrunning growth of expenditures over income brought
the United States back to the short position. The apotheosis occurred in 2009-10 – when governmental anti-crisis measures raised the budget deficit to 8% of GDP. Recently, the budget deficit was within very moderate values – about 1.5%.
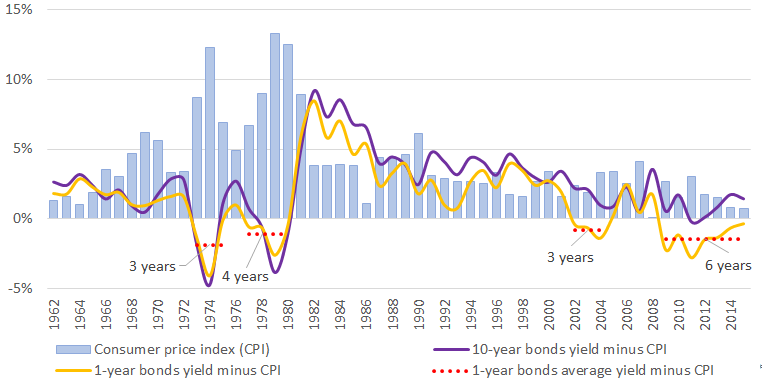
The average rate on public debt is in a long-term downtrend, which commenced back in the 80ies of the last century. Currently, the average cost of borrowing by the U.S. government is just above 2%, however the trend reversal is almost inevitable (see below).


Currently, the FRS key rate is at a minimum, and therefore the treasury bonds yield is very low. However, all experts unanimously believe that the increase in FRS rate in the near future is inevitable.
In addition to all the arguments about the FRS readiness to raise the rates, it is important to note that taking into account the actual U. S. one-year debt securities yield (adjusted for inflation), the record time is in the negative zone.
For the analysis of the debt to GDP ratio it is very important to remember that the debt absolute values are enormous, and in addition to the United States recoverable debt refinancing it is required to allocate annually a new debt in the amount of $ 0.7-1 bn.
U.S. public debt effective rate

* in periods falling below zero (the figures on the graph indicate the duration of these periods)
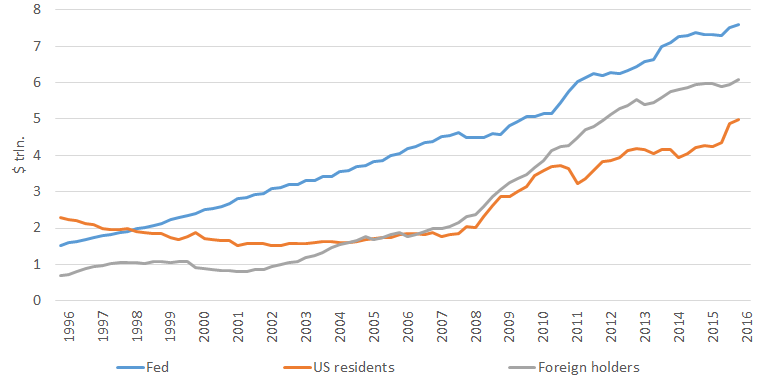
Since the mid-2000ies the U.S. non-residents drop behind on the total amount the U.S. residents own debt (except for FRS, see insertion No. 2).
Someone should buy it
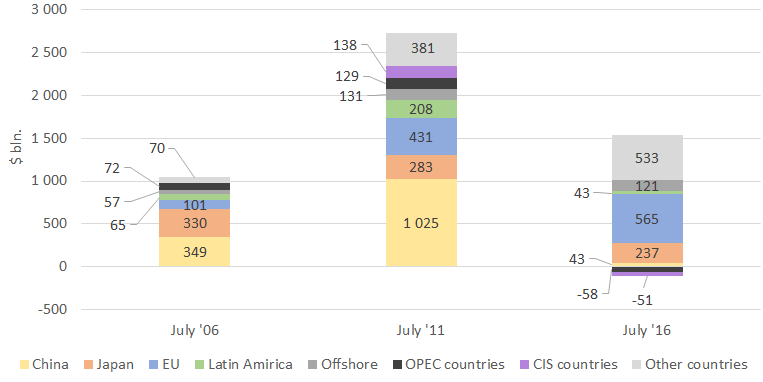
In 2010ies China was the largest foreign buyer of U.S. "new debt" (32% of new debt), however, in the past five years China ceased to build up its position.
China was substituted by a wide range of countries. The point is, whether there is still a potential for foreign investors position growth or the U.S. will be forced to allocate the debt only among the residents?
Over the past five years, the growth rate of allocation with the non-residents decreased greatly, where the growth for the last two years was virtually zero. The European Union countries are steadily increasing the U.S. debt purchase. Some groups of countries such as OPEC and CIS begin to reduce cautious their investments into U.S. public debt.
Changing in the amount of debt to foreign holders, as compared with the previous value

Debt structure
Federal Reserve System is the largest holder of the U.S. public debt; currently, it owns about 40% of the debt. Second place belongs to the foreign investors, who drew ahead of the United States residents back in the mid-2000ies. In general, it should be noted that over the past few years, the foreign investors don't increase their investments into the U.S. public debt. The debt increase is being redeemed mostly by the domestic investors.

Dynamics of the major countries and regions in US debt volume

Other red flags
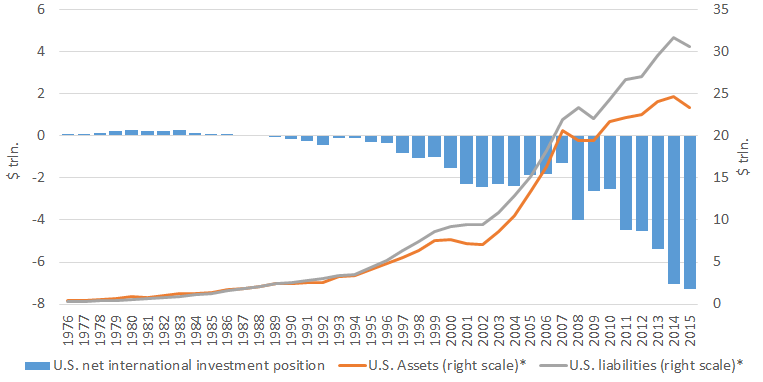
The imbalance of the U.S. financial situation is noticeable by other indicators. For example, the government's obligations and obligations of the USA residents were in excess of the assets in 2015 by more than $ 7 bn. Even the liabilities reduction in the past year failed to reduce the negative sign of the investment position since the assets reduced all the more.
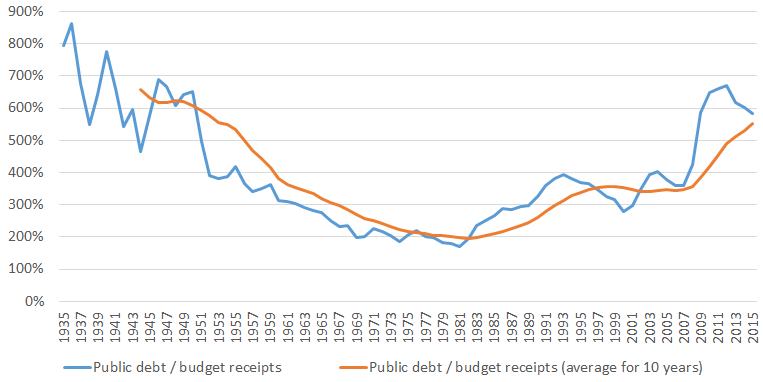
The public debt/budget revenues ratio reached its minimum of 200% in the early 80ies. In 2015, the debt exceeds six-fold the income, that is, to cover the current debt it will be required to use the U.S. budget revenues for the six years.
U.S. net international investment position

* Liabilities include the direct investments in the money market (shares and debt instruments), portfolio investments (shares and debt instruments), derivative securities (since 2005), and other instruments.
** Assets include the same components as the liabilities, including in addition the reserve assets (monetary gold, special drawing rights, etc.).
Debt to budget receipts ratio

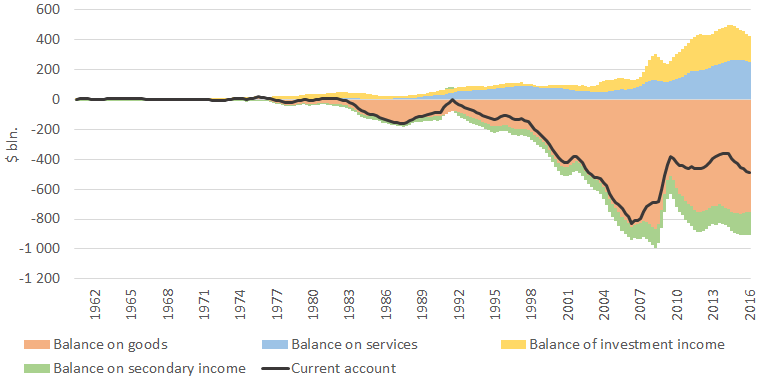
The U.S. current account position shows a steady loss within the past twenty years. Its deficit was covered by the investments into the USA, particularly into treasury bonds. But recently, a disturbing trend is observed – against the background of a new wave of growth of the current account loss the financial injections into the USA are showing a decrease.
The amount of net errors and omissions increased greatly over the past one and a half year, balancing the difference between the current and financial accounts. Since 1980, the accumulation of these errors reached $1 bln., where about half of them – for the last few years.
U.S. International Transactions

* recent figures – QII 2016
** Cumulative amount since 1980.
External account structure
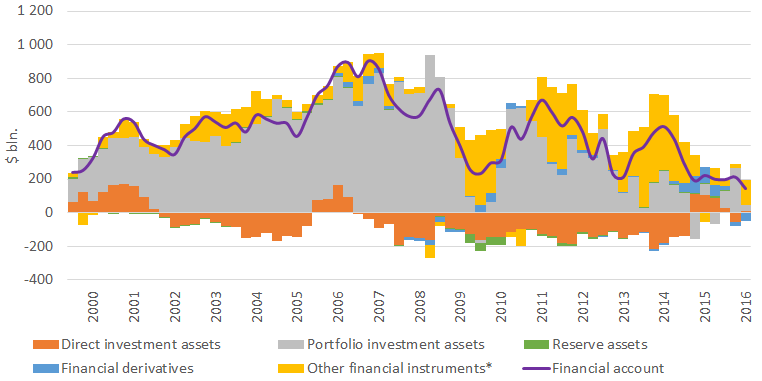
A more detailed review of the USA external account also reveals a disturbing pattern. In recent years the current account dynamics of the components has not changed much, but significant transformations occur in the financial account structure. Portfolio investments into the USA are reducing consistently since 2008. In 2013-14 the portfolio investments were substituted by other financial instruments, primarily, currency purchase and deposits, but by 2016 their potential has also exhausted. How the loss in current account positions will be financed now – remains to be seen...

Financial account structure

* Currency, deposits, loans, trade credits and advances
The USA financial system loses its foothold
Thus, the cost of U.S. public debt had reached its logical minimum, and its growth in the future is inevitable. The forecasts regarding budget deficit also don't suggest for its reduction. The future looks uneasy – the United States are moving towards the red zone, where its boundary is shifting down. It is not clear whether the applicants still remain to purchase the debt. The U.S. financial system is in a difficult situation, and its prospects are worsening every year.