What is going on with the economy of Russia?
The economic situation in Russia more reminds long stagnation, than sharp recession and quick recovery of 2008-09, and also problems in economy began in 2013.
The Gross Domestic Product (GDP) is one of the most popular macroeconomic indicators covering the general economic situation of the concrete country. GDP characterizes a resulting effect of residents’ activity, which is measured by the cost of goods and services.
The gross domestic product can be calculated by three methods:
- Production method. GDP turns out as the sum of gross added value of all residents plus net taxes on the products1.
- Method of use of the income. GDP represents the sum of expenses of all residents of sectors on final consumption, gross accumulation and net export.
- A formation method on sources of income. GDP consists of compensation of hired workers, gross profit of all residents and net taxes on production and import.
This method is not independent as according to the accepted methodology a part of indicators is undertaken from results of a method №2.
1 See the expanded schedule "The produced average annual real GDP, by types of economic activity, (articles over 4,5 trillion roubles)".
Problem of reliability of datas
It should be noted that the technique of data collection for calculation of GDP contains too many conventions. The companies usually trifle with filling of the corresponding forms of reporting. Many components of calculation of GDP contain "a number of assumptions in the conditions of very incomplete information" as recognizes Rosstat. The share of "estimated" GDP in calculation of GDP makes 25-30%2
Rosstat changed a technique of recalculation of GDP two times since 2011 that resulted in incomparability of data on nominal GDP. Also Rosstat still cannot count inflation by economy sectors for 2014. Besides, since the second quarter 2014 GDP of the Russian Federation includes data on the Crimean Federal district that complicates a possibility of comparison of these different years even stronger.
On our deep belief, it’s necessary to treat GDP very accurately as the indicator of a condition of the Russian economy. The natural indicators counted in more transparent and reliable ways often give an excellent picture. For example, in 2015 fall of GDP was significantly stronger, than decrease in electricity consumption while in 2009 the opposite situation was observed.
To be fair, it is necessary to notice that all problems stated above arise also when calculating GDP of other countries.
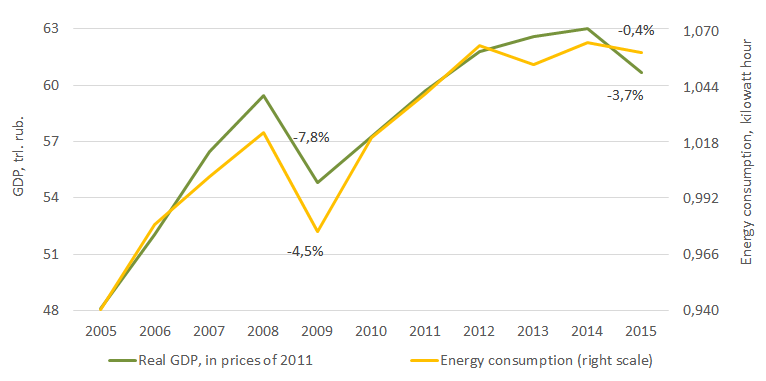
Comparison of real GDP of the Russian Federation and electricity consumption.

Figures on the picture indicate the change in comparison with last year.
Despite the aforesaid, for the lack of other figures for the analysis of state of the economy of Russia we should watch data on GDP.
2 General provisions (GDP), Rosstat, http://www.gks.ru/free_doc/new_site/vvp/metod.htm, paragraph №18. It is a footnote at the end of the section.
Problem of reliability of datas
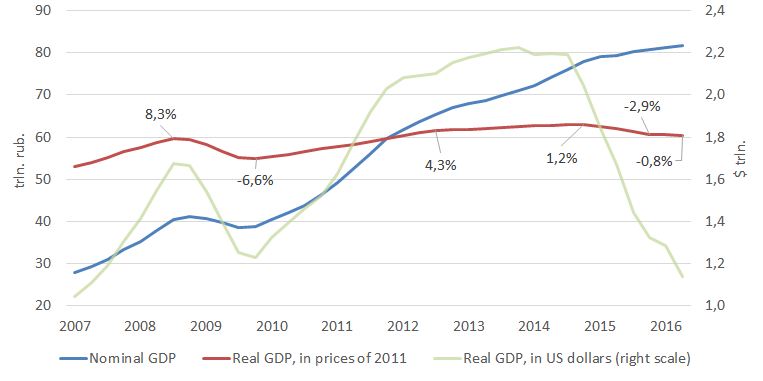
Since 2007 in dynamics of the Russian GDP it is possible to emphasize several periods.
For two pre-crisis years average annual growth rates made 8,3%. Crisis of 2008-09 lasted five quarters during which GDP fell with a speed of 6,6% per annum. Since the beginning of 2010 recovery of the Russian economy began, but growth rates were more modest than pre-crisis, about 4,3% a year. From the fourth quarter 2012 growth rates are reduced even more, to 1,2%.
Since 2015 GDP passes to decrease with a speed of 2,9% a year. In the first half of the year 2016 rates of decrease weaken to 0,8% per annum. As a result in the second quarter of 2016 GDP of the Russian Federation was approximately at the level of the beginning of 2012.
Average annual GDP, nominal, real и in USD

Figures on the picture indicate average annual growth rates from the moment of the termination of the previous tendency.
Production method
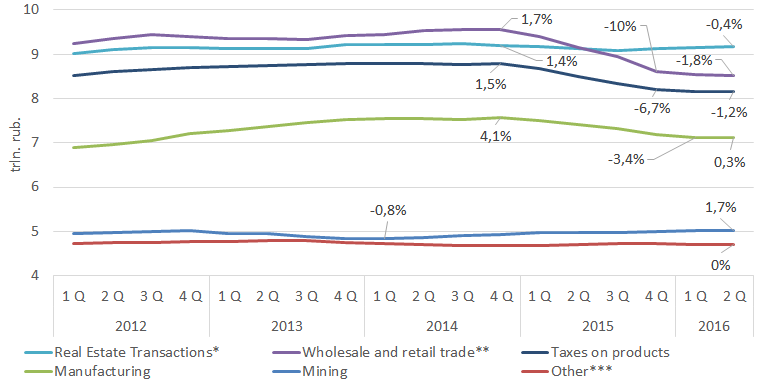
The production method of calculation of GDP allows to compare dynamics of branches of national economy. As you can see from two pictures below , from 1 quarter 2015 till 1 sq. 2016 only mining, agricultural industry and a state administration have shown growth. Mining is focused in Russia generally on export and it was helped by devaluation of ruble. The agricultural industry was strongly supported by the ban of Russia on import of food from the countries of the West, though statistically increase in production ismore than modest. The state administration sector traditionally has bigger stability in crisis situations.
At most branches at the end of 2014 the ascending tendency was broken. Among the most injured were a wholesale and retail trade (-10% per annum), taxes on products (-6,7%), construction (-4,6%), financial activity (-3,6%).
However in the first half of 2016 only construction continued falling by former rates . Sharply trade falling (to-1,8% per annum) and taxes on products (-1,2%) slowed down. Financial activity even showed growth (1,4% per annum).
The made average annual real GDP by types of economic activity (articles less than 4,5 trillion roubles)

Figures on the picture indicate average annual growth rates from the moment of termination of previous tendency
* including rent and rendering of services
** including hunting, forestry, fishery and fish breeding
*** production and distribution of the electric power, gas and water; hotels and restaurants; granting others municipal, social and personal services; activity of households
Average annual GDP, nominal, real и in USD
")
Figures on the picture indicate average annual growth rates from the moment of termination of previous tendency
* including provision of social services
** including repair of vehicles, motorcycles, household products and objects of private use
*** including provision of military safety and social insurance
Method on use of the income
Here import reduction is the most noticeable.
It began in the fourth quarter 2013, long before the devaluation of rouble and countersanctions intorduced at the end of 2014. In 2015 import reduction sharply amplified to 25,7% annual3. In the first half of 2016 average annual rates of reduction weakened to 7,8%.
Due to the devaluation it would be worth expecting strong export growth, however the rates of its growth which found reflection in statistics, are quite moderate, about 1,9% a year. At the same time it should be noted that at least, export is growing at least since 2012
The used average annual real GDP

Figures on the picture indicate average annual growth rates from the moment of termination of previous tendency
Expenses of households, as well as the majority of other GDP components, fell at the beginning of 2015. The ascending tendency of gross accumulation of fixed capital was already developed in the second quarter 2013, and since then this GDP component only decreases (on average by 6% a year).
3 In calculation of the used GDP import plays a negative role, the less it is, than the GDP is more.
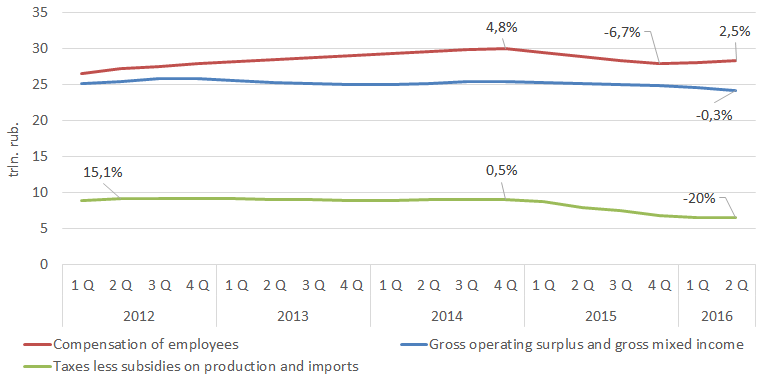
Formation method on sources of the income
The ascending tendency of compensation of hired workers was broken at the beginning of 2015, from +4,8% to-6,7% a year. But in the first half of the year 2016 the positive trend returned, though weaker (2,5%).
Net taxes on production and import, after several years of stagnation, accelerated the decrease in the same first quarter 2015 to 20%.
In general,the gross profit and incomes of residents of economy decreased by small rates for the last four years. It is worth paying attention that within the beginning of crisis special changes in this trend did not occur.
Average annual real GDP on sources of the income

Figures on the picture indicate annual growth rates from the moment of termination of previous tendency
Development and electricity consumption
Development and electricity consumption, unlike GDP, is determined with much bigger accuracy. The expansion in consumption of the electric power can actually be considered as reflection of economic growth though, certainly, some distortions in correlation are brought by increase in energy efficiency.
From the point of view of electricity consumption the current situation in economy cardinally differs from crisis of 2008-09. At that time quite sharp falling was observed, more than for 4%, however by 2010 the situation was completely restored. The current situation is more similar to long stagnation, in three years (2013-2015) both development and consumption were reduced (though by only 0,1%). And it is possible to notice that decrease already began in 2013.
Development and electricity consumption

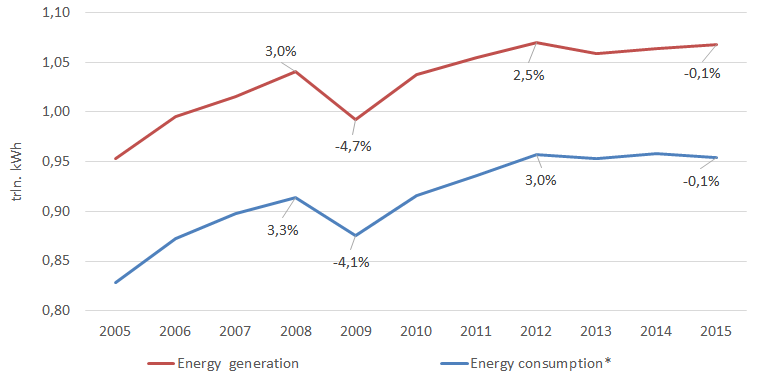
Figures on the picture indicate annual growth rates from the moment of termination of previous tendency
* minus losses in power supply networks
Electricity consumption by city and rural population

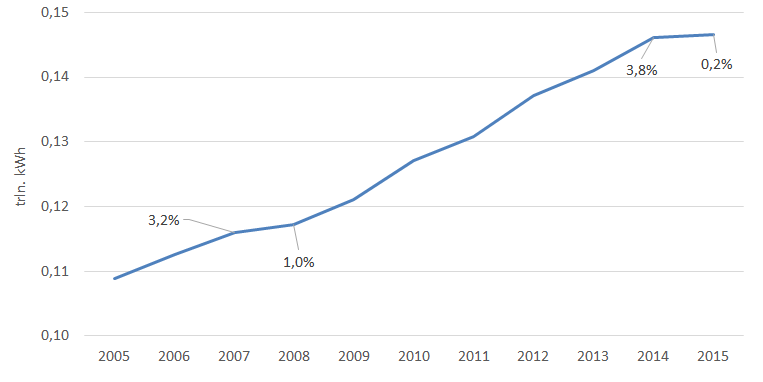
Figures on the picture indicate annual growth
rates from the moment of termination of previous tendency
In 2015 electricity consumption by the population showed the lowest growth rates over the last ten years, for only 0,2%. The electric power is quite cheap product and is among basic needs of the modern population. Even delay of rates of its growth can be considered as a negative signal of welfare of the population. For comparison – in 2008 growth slowed down about 1%, and in 2009 growth rates returned to pre-crisis.
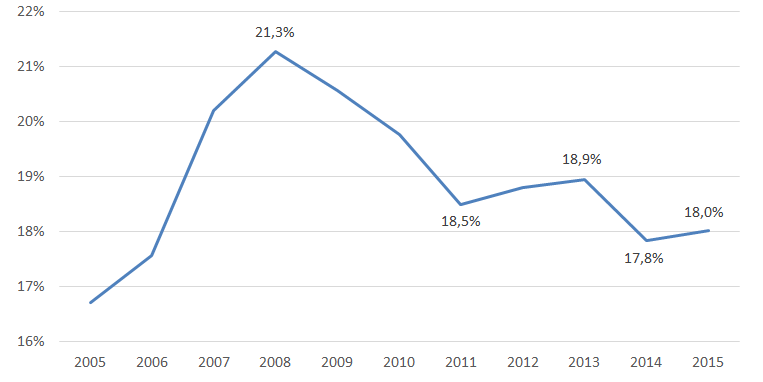
Investments into fixed capital
Investments into fixed capital actively grew till 2008 that was promoted by the cheap credits against the background of low interest rates. Increase in rates during crisis of 2008-09 evolved a tendency. In spite of the fact that in 2010 rates returned to the previous levels, the percent of capital investments to GDP did not show growth. Weak increase in 2011-2013 was again replaced by falling, already because of the following crisis and accompanying it increases in rates.
In 2015 we saw the small growth of percent to GDP, but it was very weak and is more explained by fall of GDP, than increase in absolute volume of investments.
Thus, on this indicator Russia is now at the level of 2006-07.
Average annual real GDP on sources of the income

Figures on the picture indicate annual growth rates from the moment of termination of previous tendency
Cargo transportation by railway
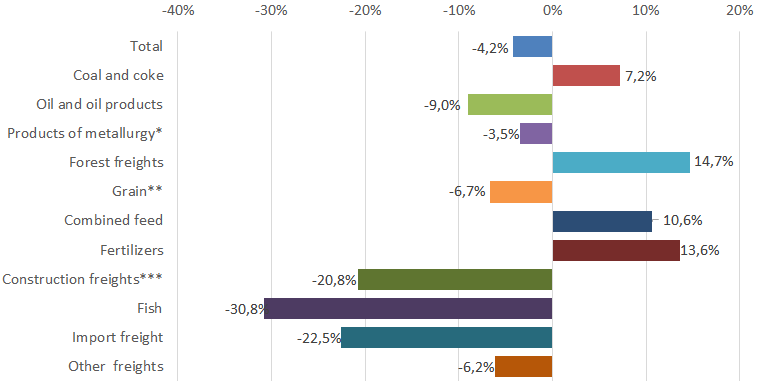
In comparison with the previous crisis the current falling of total amounts of transportations is significantly weaker, but lasts longer – the third year in a row.
Changes in a cargo transportation for the last four years vividly reflect transformations in economy. Transportations of import (by 22,5%) and construction freights ( by 20,7%) were sharply reduced
In connection with the reciprocal food sanctions the domestic agricultural industry became more active that was reflected in growth of transportations of fertilizers and compound feeds (13,6% and 10,6% respectively).
The volume of a cargo transportation on railway

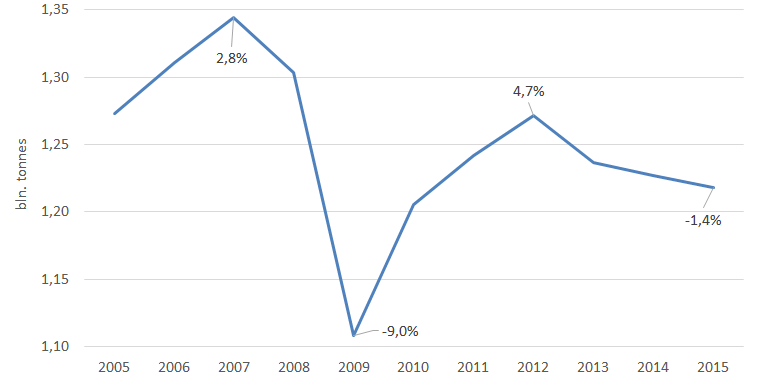
Figures on the picture indicate annual growth rates from the moment of termination of previous tendency
Dynamics of transportations of various freights on railway for the first seven months from 2012 to 2012

* ore iron, ores of non-ferrous metals and sulfuric raw materials, ferrous metals and their scrap
** and regrinding products
*** including cement
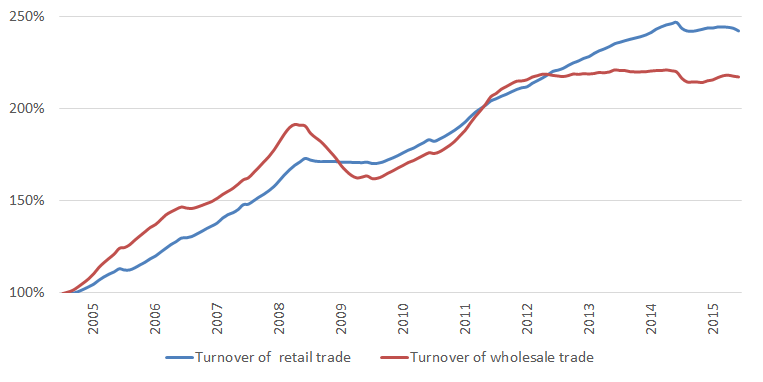
Wholesale and retail trade
Wholesale trade ceased to grow at the end of 2012, having reflected the problems which were accumulated by then in national economy.
Retail trade proved to be more inert indicator – in 2008 against the background of falling of wholesale trade it only stagnated. At the beginning of 2015 it showed the strongest falling over the last ten years. It is worth paying attention that statistically the gap between growth of wholesale and retail trade which, perhaps, is explained by growth of a trade margin began with the middle of 2012.
Turnover of wholesale and retail trade change per year, in fixed prices (December 2004. = 100%)
")
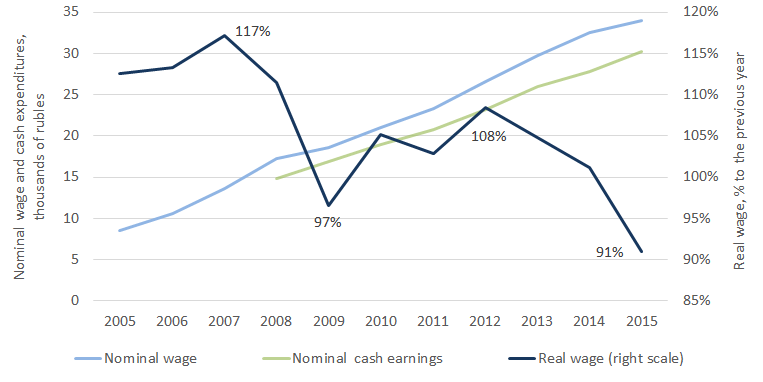
Salary and monetary income
The current crisis was reflected in the salary and incomes of Russians much stronger, than the previous one.
In 2009 real salaries made 97% from the previous year, in 2015 – 91%.
Dynamics of the salary and monetary income of the population

*in % to the previous year
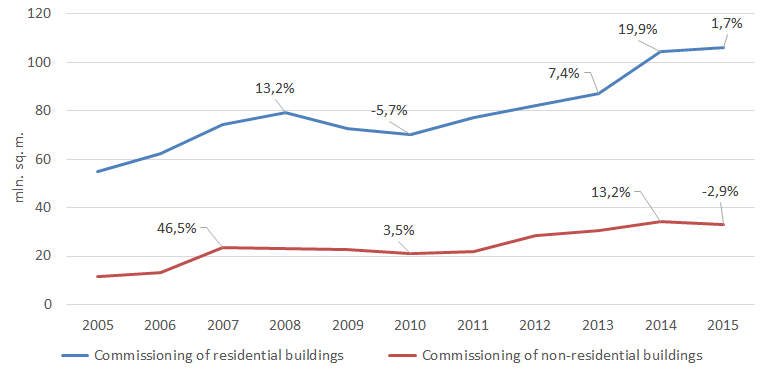
Construction
According to datas on GDP the construction branch began to be reduced in 2013. Nevertheless, on natural results of construction branch negative tendencies are not noticeable yet.
In the previous crisis the area of the residential buildings put into operation was reduced two years in a row (2009-10), but in 2014 the indicator not only did not fall, but also showed the highest annual increase rates – almost for 20%. However a disturbing tendency are the reduced volumes of transportation of construction freights by railway.
Commissioning of residential and non-residential buildings

Figures on the picture indicate annual growth rate from the moment of termination of previous tendency
The current situation is not similar to last crisis
In spite of the fact that GDP is very conditional and estimated indicator, natural indicators confirm the stagnation observed by GDP statistics. The beaten-out indicators are commissioning of buildings and electricity consumption.
On a number of indicators, in particular investments into fixed capital and cargo transportation on railway, crisis began already in 2013, that is long before drop in oil prices and the western sanctions. Effect of devaluation of rouble and countersanctions did not find noticeable reflection in GDP statistics yet.
Difference from crisis of 2008-09 consists that many indicators did not fall so sharply, but the descending tendency was already much more longer. Besides, the current crisis was reflected in a level of living of Russians much stronger, than crisis of 2008.